W. Sherman Rogers (3-2-20)
Note: I posted this blog when President Trump was still referring to the coronavirus epidemic as a “hoax” and before markets began to tumble dramatically. I mentioned the coronavirus epidemic as a possible trigger for an economic downturn near the end of the post.
The U.S. cannot forever fund the government it has chosen given:
- the tax code it currently has (especially the tax code it has had as of 2017);
- the domestic promises it has made (e.g., Social Security, Medicare, etc); and
- the defense it needs.
The brief discussion that follows is not an endorsement for or against any political party. Indeed, you won’t hear any political party speaking about what I’m about to discuss; at least until economic disaster strikes or appears to be imminent. So let’s get started with some facts. See George F. Will, A Plan to Treat Wealth Like Wages, Washington Post, February 21, 2020, A21.
There is only way to pay for Social Security and Medicare INTO WHICH 10,000 BABY BOOMERS RETIRE DAILY. The solution is to raise present taxes and future taxes. Alternatively we can slash benefits to the point where we can pay for them.
Who wants higher taxes? That’s why conservatives, who believe in a version of the classical liberal school of economic thought, tend to focus on slashing or eliminating government social welfare programs as opposed to raising taxes. In my Winners and Losers book, at page 8, I note that politicians of this school of thought tend to target two-thirds of proposed spending cuts from government welfare, pension and social programs.
President Trump’s recent budget proposal unveiled on February 10, 2020 substantiates the statement in my book.
The president’s new budget proposal:
- Calls for removing $500 billion in funding from the Medicare program over the next 10 years including $135 billion from Medicare prescription drugs and tens of billions from the Social Security
- Requests a $920 billion cut in Medicaid
- Asks for a $844 billion cut to Obamacare
- Proposes to add another $3.4 trillion to the federal debt by 2024 ON TOP OF THE $3 trillion the president has added in just three years by piling on a $1- trillion-a year in budget deficits during a peacetime expansion of the economy
[See Dana Milbank, Trump’s Budget Reveals a Tremendous Fraud, February 11, 2020, Washington Post, sec. A21] [Please note that each February, the president sends a budget request to the Congress for the coming fiscal year. The federal government’s fiscal year is from October 1 to September 30. See Winners and Losers at 350.
The fact that Congress won’t agree to such cuts is not the point. The point is that neoclassical conservative thought focuses on reducing spending, not raising taxes.
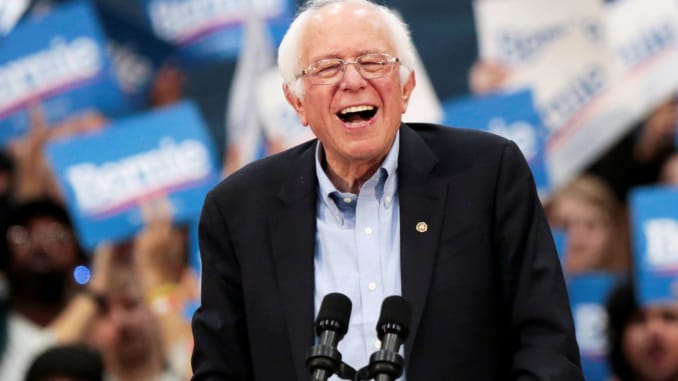
BERNIE SANDERS’ SEVEN MAJOR POLICY PROPOSALS, THEIR COSTS, AND PAYING FOR THE PROPOSALS IF ENACTED
Over the next ten years, the Congressional Budget Office estimates that EXISTING DEFICIT SPENDING UNDER CURRENT POLICES for the next ten years will cost the U.S. $13.1 trillion.
Bernie Sanders’ policy proposals alone—if enacted—would add another $41.6 trillion in deficit spending over the next ten years.
A recent article breaks down THE COSTS OF SEVEN PROGRAMS PROPOSED BY SANDERS. This allows you to see each of Sanders’ specific proposals and the estimated cost for each of them. See Robert J. Samuelson, How Much Will Socialism Cost? $50 Trillion, Washington Post, February 27, 2020:
BERNIE SANDERS’ POLICY PROPOSALS AND THE COST OF THOSE PROPOSALS
Free college—$2.2 trillion
Expansion of Social Security and Other Retirement Benefits—$1.4 trillion
Housing for all—$2.5 trillion
Eliminating household medical debts—$81 billion
Green New Deal (programs to help stop global warming)—$16.3 trillion
Universal child care and preschool—$1.5 trillion
Medicare for all—$17.5 trillion
Samuelson added these numbers to the $13.1 trillion in deficits under existing policies for the next ten years. He arrived at a cost of $54.6 trillion to fund Sanders’ brand of socialism. Thereafter, he rounded that number down to $50 trillion.
TOTAL GOVERNMENT SPENDING OVER THE NEXT TEN YEARS WITHOUT SANDERS’ PROGRAMS AND WITH THE EXTRA SPENDING FROM SANDERS’ PROPOSALS (IF ENACTED)
Samuelson’s article states that, to put these numbers in perspective, that the Congressional Budget Office (CBO) expects that UNDER EXISTING LAWS the federal government will spend a total of $60.7 trillion over the next decade. THE SANDERS’ PROPOSED PROGRAMS WOULD ADD AN EXTRA $50 trillion over the same period (according to the article).
THIS WOULD EXPAND THE SIZE OF THE GOVERNMENT BY ROUGHLY 80 PERCENT.
Samuelson notes further that, IF ALL THE EXTRA SPENDING WERE COVERED BY DEFICITS—which requires that the U.S. to borrow money to cover the shortfall—THE PUBLICLY HELD FEDERAL DEBT—which is the U.S. debt minus the amount it owes to other parts of the U.S. government (e.g., the Social Security Trust Fund)—WOULD RISE FROM $16.8 TRILLION IN 2019 TO $66.8 TRILLION IN 2030.
[You can read my Winners and Losers book at 342-343 to get an understanding of the difference between the Gross Federal Debt, Net Federal Debt, and the General Government Debt].
ON THE OTHER HAND, IF ALL THE SPENDING INCREASES WERE COVERED BY TAX INCREASES, THE OVERALL LEVEL OF TAXATION WOULD ROUGHLY DOUBLE over the next ten years.
SOME THINGS TO CONSIDER
Budget Deficits
Let’s get some terminology out of the way as the first order of business. A budget deficit occurs when the federal government’s spending is greater than its tax revenues. See Winners and Losers at 340.
When I wrote my Winners and Losers book, the annual deficit for 2014 had fallen 29 percent to $483.35 billion. That’s certainly a whole lot of money the U.S. spent OVER the amount it raised in taxes. This was true even though the government’s revenues in 2014 was $3.01 trillion. Therefore, as you can see, the government spends a whole lot more money than what it brings in—like $483.35 billion extra in 2014. See Winners and Losers at 340.
In large part because of the 2017 tax cut legislation, THE FEDERAL DEFICIT FOR 2019 HAD RISEN TO $738.6 BILLION FOR THE FIRST 8 MONTHS OF 2019. Quite a shocking number.
When the government does not have enough revenues to pay its bills, IT MUST BORROW TO PAY THE DIFFERENCE (i.e., the $483.35 billion in 2014). In other words, the U.S. spent $483.35 billion MORE than what it had in income in 2014.
Yet, the Trump administration in 2017 cut taxes (primarily for the benefit of corporations and the very wealthy). At the same time, Trump proposed spending cuts to pay for these tax cuts. And as you already know, typically, conservatives such as the House Freedom Caucus and Trump target “roughly two-thirds” of proposed cuts on programs for low and moderate income people. We call this TRICKLE-DOWN ECONOMICS (also known as supply-side economics). See Winners and Losers at 42-43, 207.
To refresh your memory, President Trump’s recent budget proposal unveiled on February 10, 2020:
- Calls for removing $500 billion in funding from the Medicare program over the next 10 years including $135 billion from Medicare prescription drugs and tens of billions from the Social Security
- Requests a $920 billion cut in Medicaid • asks for a $844 billion cut to Obamacare
- Proposes to add another $3.4 trillion to the federal debt by 2024 ON TOP OF THE $3 trillion the president has added in just three years by piling on a $1- trillion-a year in budget deficits during a peacetime expansion of the economy
[See Dana Milbank, Trump’s Budget Reveals a Tremendous Fraud, February 11, 2020, Washington Post, sec. A21]
ANNUAL DEFICITS ARE ADDED TO THE FEDERAL DEBT SO HOW DOES THE U.S. GET THE MONEY TO PAY FOR ITS DEBTS?
THE U.S. MUST BORROW MONEY TO PAY ITS DEBTS. The Federal Reserve—which has the exclusive responsibility to issue paper money—does not issue paper money to cover the federal government’s deficits. ACCORDINGLY, THE COMMON BELIEF THAT THE FEDERAL GOVERNMENT PRINTS CURRENCY TO FINANCE ITS DEFICITS IS A FALLACY. See Winners and Losers at 273.
However, you should note that there is a very controversial theory called “Modern Monetary Theory.” Modern Monetary Theory (MMT) argues that in any country with its own currency, budget deficits don’t matter unless they cause inflation. MMT maintains that the government can pay for what it needs by simply printing more money—no reason to borrow by issuing bonds. THERE IS HUGE OPPOSITION BY ECONOMISTS TO THE THEORY. But there is some support for the theory. See generally, Peter Coy, Stephanie Kelton’s MMT Theory: The People Who Defined 2019, Bloomberg Business Week, December 29, 2019 at 40. But remember, MMT is just a theory. And a pretty scary one to many economists.
So how does the government pay for its budget deficits? The government issues bonds—i.e., treasury securities referred to as treasury bonds, treasury notes, treasury bills, and treasury issued savings bonds—as the mechanism by which it borrows money from lenders who become creditors of the United States. This borrowing is how the U.S. makes-up the difference for the $483.35 billion that it did not have in 2014. See Winners and Losers at 341.
The $483.35 billion (or more) that the government borrowed to make up the deficit for 2014 was added to the accumulated federal debt. These accumulated loans that the government makes to finance the U.S. annual budget deficits—i.e., THE U.S. DEBT—CURRENTLY STANDS AT A TOTAL OF $ 22 TRILLION. Please see page 342 of Winners and Losers to see exactly who loans money to the United States.
NOTE: TO LEARN THE DIFFERENCE BETWEEN THE GROSS FEDERAL DEBT, THE PUBLICLY HELD DEBT, THE NET FEDERAL DEBT, AND THE GENERAL GOVERNMENT DEBT, SEE WINNERS AND LOSERS AT 342-343
FOR THE RECORD, AS WE MENTIONED EARLIER, BY MAY 2019, THE FEDERAL DEFICIT FOR 2019 HAD RISEN TO $738.6 BILLION FOR THE FIRST 8 MONTHS. PLEASE NOTE THAT THE U.S. FISCAL YEAR RUNS FROM OCTOBER 1-SEPTEMBER 30. SEE WINNERS AND LOSERS AT 350.
THE STAGGERING AMOUNT OF INTEREST THE U.S. PAYS ANNUALLY ON ITS ENORMOUS DEBT CONTINUES TO GROW
The interest on the national debt is how much the federal government must pay on outstanding public debt each year. The interest on the debt in 2019 was about $479 billion. In 2014, for example, the interest on the federal debt was $229 billion. See Winners and Losers at 348.
A February 13, 2019 news flash reported that the Congressional Budget Office (CBO) predicted that INTEREST PAYMENTS ON THE DEBT WOULD RISE TO RISE TO $928 BILLION BY 2029 IF THINGS CONTINUE THE WAY THEY ARE GOING NOW.
Indeed, the CBO predicted that the fastest growing item in the budget over the next decade will be interest on the debt. Moreover, the CBO determined that if tax cuts and spending increases are extended, interest will exceed $1 trillion and set a new record as a share of the economy.
THE GLOBAL DEBT PROBLEM
The global economy, as of 2018, was awash in debt — not just (1) CORPORATE DEBT but also (2) record amounts of GOVERNMENT DEBT, (3) HOUSEHOLD DEBT and (4) INVESTOR DEBT— at a time when interest rates are rising from historically low levels. And the situation, judging by current data, has gotten worse since 2018.What will happen if the current low interest rates we have now begin to rise? See generally, Steven Pearlstein, The Buyback Economy and the Next Big Bubble, Washington Post, June 10, 2018, sec. G1.
HERE’S MORE PROOF OF WHY WE ARE CRUISIN FOR A BRUISIN AND SOWING THE SEEDS FOR SOME BAD TIMES AHEAD
- In the Trump administration’s first three years in office, it has added more to the nation’s debt—a whopping $2.6 trillion in additional debt. On the other hand, it took the preceding administration a full four years to add “just” $2.1 trillion to the debt. See George F. Will, A Plan to Treat Wealth Like Wages, Washington Post, February 21, 2020, A21.
- In calendar year 2019, the federal deficit—i.e, the shortfall between what the government spent and the revenues it raised to pay for those expenditures—was $1.02 trillion. This was a 17.1 increase over 2018. But this was nothing compared to the 28.2 percent increase in the deficit compared with the 2017 figures. The scary aspect is that these deficits are occurring during a time of full-employment and fairly good economic growth (2.3 percent). Id.
- During the Trump administration’s first three years, the federal deficit has grown 20.8 percent per year. On the other hand, the previous administration showed a 9.4 percent annual decline in the deficit per year. Id.
- During the Trump administration’s first three years, annual revenue through taxes increased by 2.6 percent. In the preceding administration, the revenue increase was 3.9 percent. Id.
- During the Trump administration’s first three years, spending has increased 5.7 percent per year. The spending increase per year under the previous administration was 2.6 percent year. Id.
- The President’s 2017 tax cuts were supposed to grow the economy between 4-6 percent. Last year, it grew at 2.3 percent. Nevertheless, the president’s proposed budget would devote another $1.4 trillion to extend cuts designed primarily for the rich. [See Dana Milbank, Trump’s Budget Reveals a Tremendous Fraud, February 11, 2020, Washington Post, sec. A21]
THE BUSINESS CYCLE HAS NOT DIED, AND THRE WILL BE ANOTHER ECONOMIC DOWNTURN
Consumer spending is responsible for about 70 percent (or more) of our national income (gross national product). See Winners and Losers at 161. Therefore, as long as Americans keep on spending lots of money on new goods and services produced domestically, the economy will be able to hang in there. BUT IF CONSUMERS SLOW THEIR SPENDING….
THE BUSINESS CYCLE IS NOT DEAD AND THEIR WILL BE DOWNTURN IN THE FUTURE. SEE WINNERS AND LOSERS AT 176-179 AND 277.
FOR EXAMPLE, SOMETHING AS RANDOM AS THE CORONAVIRUS could begin a downturn. As Chris Meekins, an analyst with the Raymond James firm noted:
When people are worried about catching a disease, you’re not going to go out to dinner; you’re not going to go to the movies or sporting events or concerts. The only question is how widespread this becomes.
AND BECAUSE AMERICAN CONSUMERS ARE RESPONSIBLE FOR AS MUCH AS 76 PERCENT OF U.S. GROSS DOMESTIC PRODUCT—SEE WINNERS AND LOSERS AT 161—a substantial drop in consumer spending would devastate the U.S. economy.
Additionally, because of the coronavirus, factories around the world are grappling with parts shortages as their Chinese suppliers grapple to resume normal operations. See David Lynch, Rachel Siegel, and Robert Costa, Global Markets Tumble as Virus’s Reach Expands: Broken Supply Chains, Wary Consumers, Washington Post, February 25, 2020, sec. A1.
WE DON’T KNOW WHAT WILL CAUSE THE NEXT ECONOMIC DOWNTURN. It’s hard to say what will cause the giant debt bubble to finally pop. A Turkish lira crisis. Oil prices topping $100 a barrel. A default on a large BBB bond. A rush to the exits by panicked ETF investors. TRYING TO FIGURE OUT WHAT WILL CAUSE THE NEXT DOWNTURN IS A FOOL’S ERRAND. PRETENDING IT WON’T HAPPEN IS FOLLY. See generally, Steven Pearlstein, The Buyback Economy and the Next Big Bubble, Washington Post, June 10, 2018, sec. G1.